In moving averages in forex trading are used in three main ways:
- To assist in identifying the trend of the market
- To assist in identifying dynamic support and resistance levels
- To assist in executing trades using their crossovers
- Using moving averages to identify the market trend
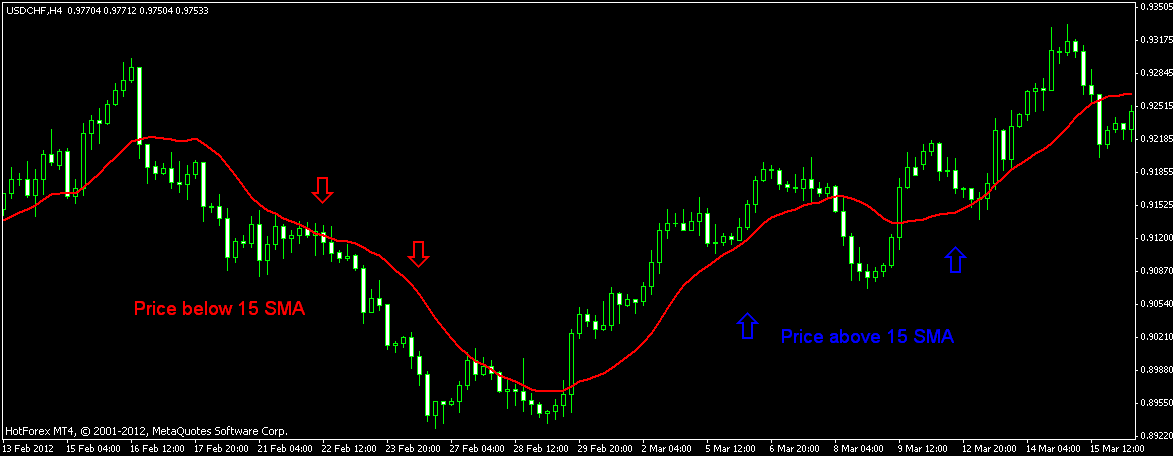
This is simply done by plotting a single moving average on the chart of any currency pair. And, when the price action seems to stay above the moving average, then it would indicate that the pair is on an uptrend.
On the other hand, when the price action seems to stay below the moving average, then it would indicate that the pair is on a downtrend.
A picture is worth more than 1000 words:
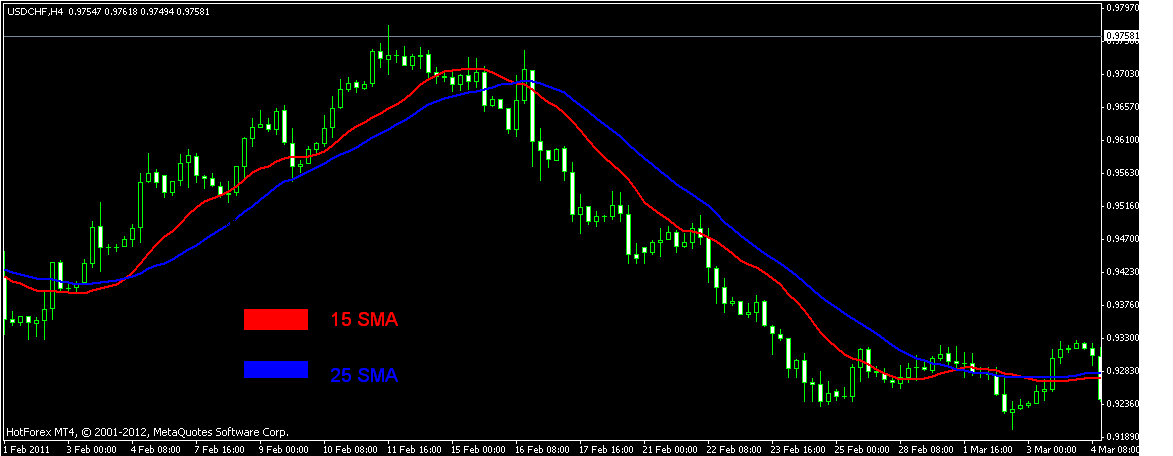
Notice that when price action is generally below the 15 SMA, the pair is on a downtrend. And, when price action is generally above 15 SMA, the pair is on a downtrend.
For a sideways trend, the moving average is often confined within the price action, and not away from it as in either a downtrend or an uptrend.
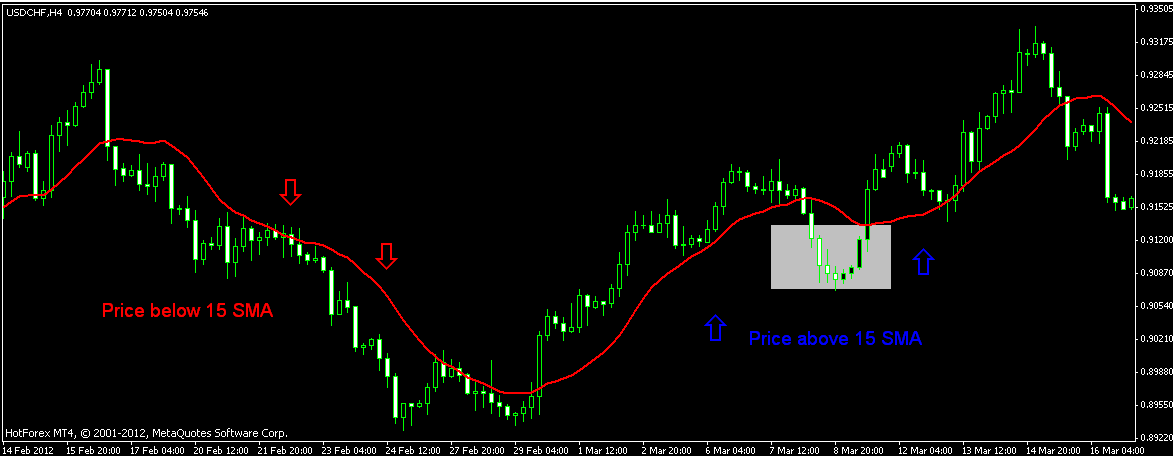
The problem with this method is that it is too simplistic. For example, notice the shaded area in the diagram below.
If you thought that the pair had changed trend since price action fell below the 15 SMA, then you could be seriously wrong.
After the slight decline, price continued with the uptrend. Therefore, to filter such moves, it is advisable to plot more than one moving average on charts.
If you do this, you will get a clearer indication of whether the pair has changed the trend or not.
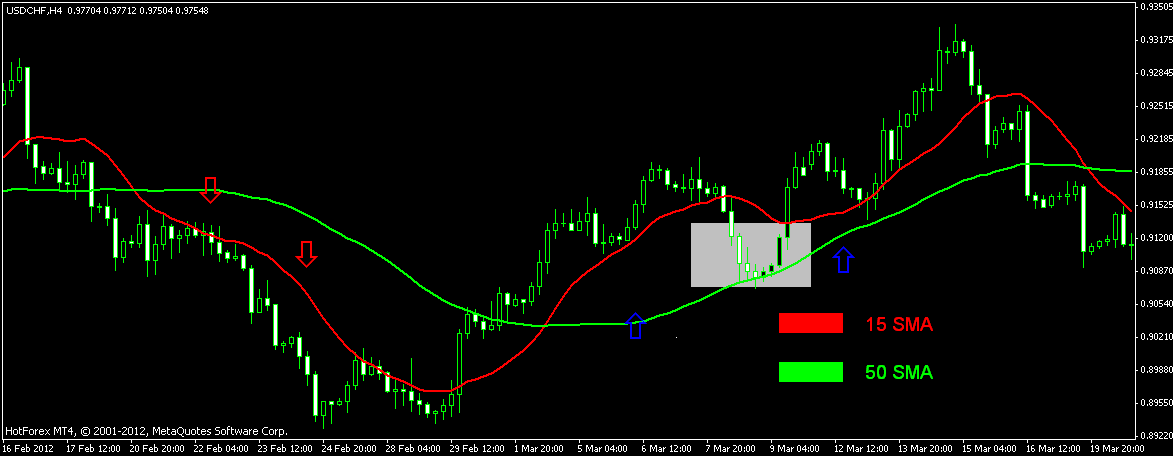
Let’s add 50 SMA on the chart and see the difference:
(Note that we have chosen the periods of the moving averages for use in these examples based on our past experiences with them. You can choose any period that best suits you)
In a market on an uptrend, the faster moving average should always be above the slower moving average. And, the reverse is true for a market on a downtrend.
As seen on the above diagram, all through the downtrend, the 50 SMA is above the 15 SMA. And, all through the uptrend the 15 SMA is above the 50 SMA.
You can also add more than two moving averages on your chart to assist you in determining whether the market is trending up or down.
Thus, you can use moving averages to assist you determine the current trend of the market.
If you combine this knowledge with other strategies in forex trading such as trend lines or candlestick analysis, you will definitely reap big in this business.
- Using moving averages in forex trading to identify dynamic support and resistance levels
Moving averages can also be used as dynamic support and resistance levels. The word ‘dynamic’ is used because they are not similar to the usual horizontal support and resistance lines, as the moving averages change frequently according to the happenings in the market.
Most forex traders use moving averages as important support and resistance levels.
To trade using this strategy, these traders normally enter long positions when price falls and touches the moving or average or enter short positions when price rises and touches the moving average.
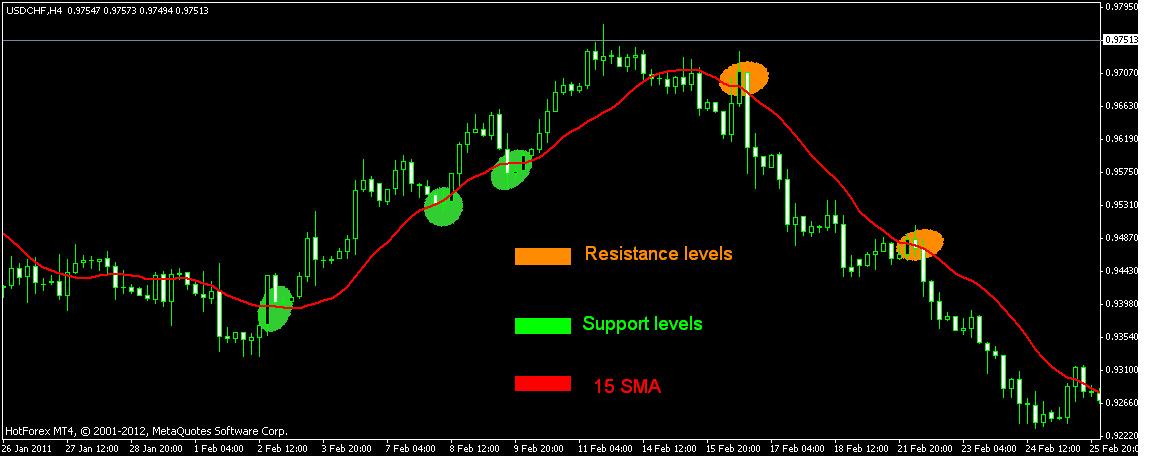
Let’s illustrate this further using a chart:
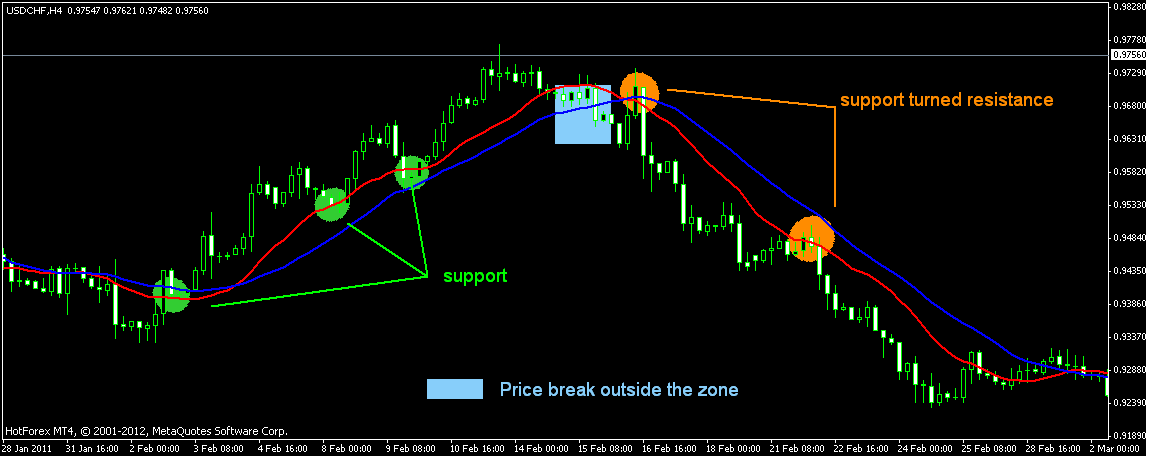
From the chart, you can see that each time price approached the 15 SMA and touched it, it acted as either support or resistance level. Therefore, trades can be entered at these levels.
It is important to note that these work just like the normal support and resistance lines; thus, price does not always bounce off perfectly from the moving average.
At times, price may pierce the moving average to the other side before coming back to resume with the current trend. Or, price may break past the moving average and change the trend completely.
Therefore, to prevent you from being caught in a false breakout, you can add another moving average on your chart.
From the graph, you can see that there is a space between the two moving averages. This space can be interpreted as the zone of support or resistance.
Every time price enters the zone and does not break past it, then it is a good indication that the trend has not changed.
What happens when dynamic moving average levels are clearly broken?
Similar to support and resistance levels, dynamic moving average levels can also be clearly broken. Let’s have a closer look at the previous chart:
In the diagram above, it is evident that when price breaks past the zone of support, it reverses the trend to the downside.
When the dynamic support and resistance levels of moving averages are broken, it is good to confirm the breakout with other strategies, such as break of trend lines or appearance of candlestick reversal patterns.
- Using moving averages crossovers to execute trades
When two or more moving averages are plotted on a graph and a crossover occurs, this usually gives signals of potential trade opportunities.
It is important to note that all moving average crossover strategies have similar interpretations.
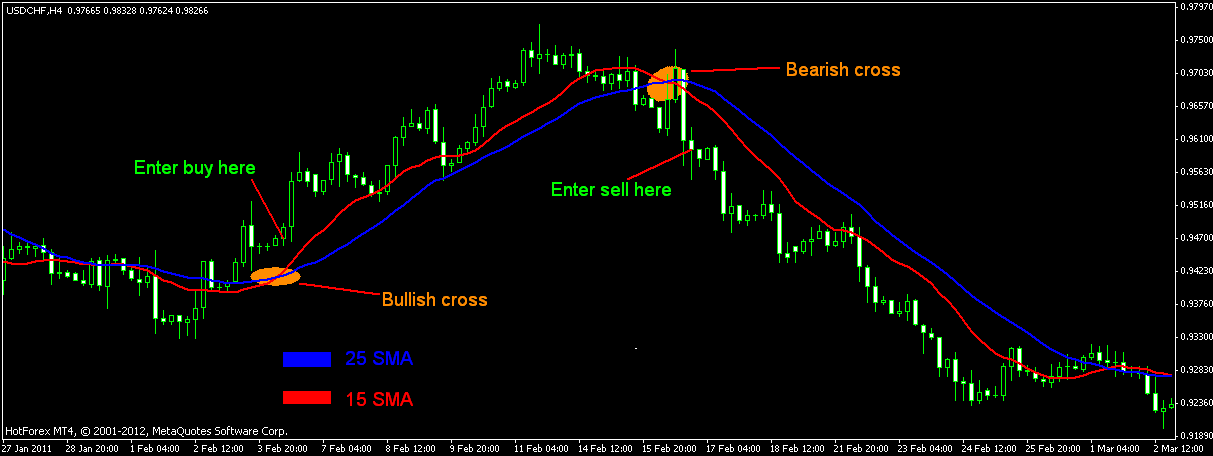
When two moving averages are used, a buy signal is generated when the short-term moving average crosses over the long-term moving average (bullish crossover).
On the other hand, a sell signal is generated when the short-term moving average crosses under the long-term moving average (bearish crossover).
The chart below illustrates this:
Summary
- The moving average crossover strategy works best in a trending market. When the market is on an upward, a buy signal becomes more predominant. On the other hand, if the market is on a downtrend, a sell signal becomes more predominant.
- Most traders usually quit their positions once a new crossover has occurred or when they have been in profits for a certain amount of pips. It is better to use the second method because sometimes it is not very easy to know when the next crossover will occur. Other moving averages in forex trading methods such as support and resistance can also be used to determine when to quit such trades.

Recently started trading. Very useful information. Thank you so much.
Forex Trading is the hardest thing to do without adequate information concerning dynamic moving averages, support and resistance. I know many people out there will gain a lot.
Please contact us through the contact form on this site for more assistance on this. Thanks.